|
A summary of key dates relating to the implementation of the ETS Phase IV deal, and further ETS reform. 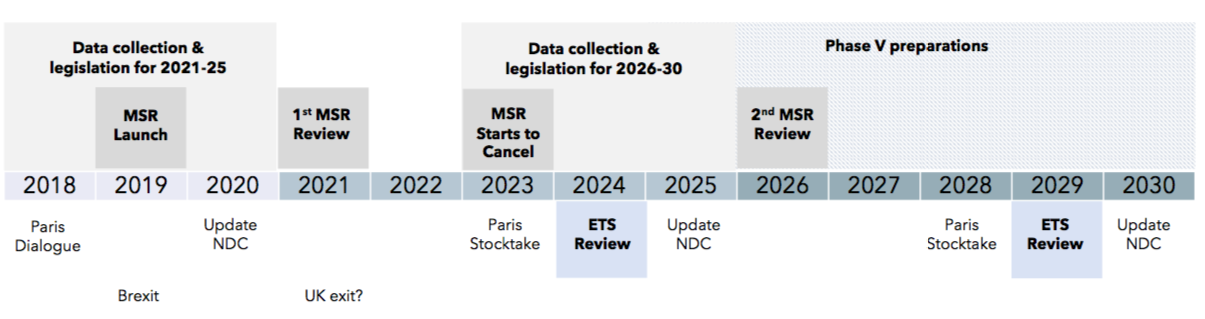
0 Comments
This graph shows under what circumstances a CSCF will be triggered in Phase IV. A data point above the curve represents an activity level and benchmark scenario that would trigger a CSCF; a data point below the curve represents an activity level and benchmark scenario that would not trigger a CSCF. 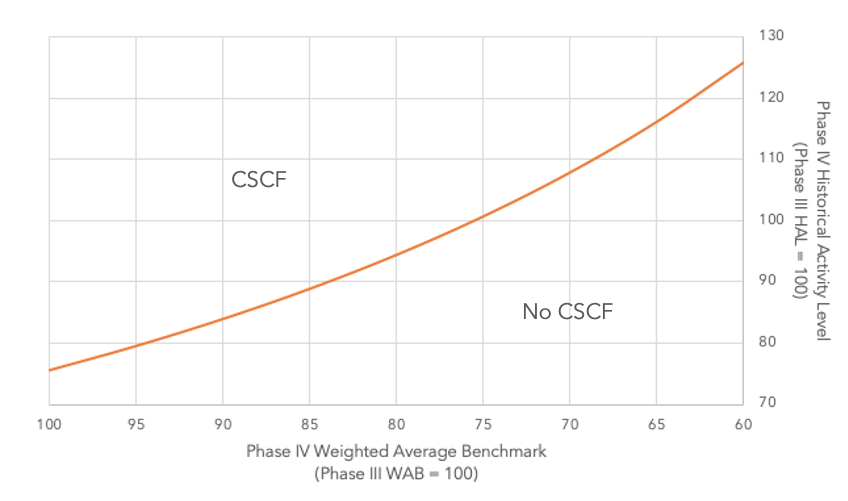 Explanation
Benchmark reduction rates If we assume no change in the proportion of activity associated with each benchmark, Phase IV WAB values would correspond as follows to the annual benchmark reduction rates used by the European Commission to revise benchmarks: 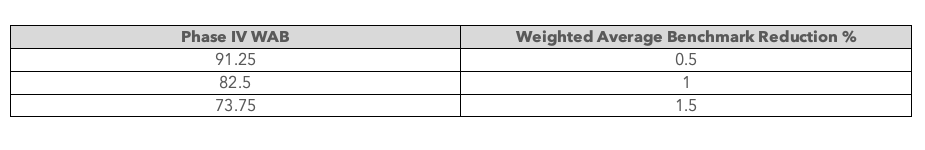 Of course, the weighted average benchmark reduction percentage is unlikely to be uniform across all benchmarks (or equivalent to the simple average) and it may be influenced by a change in the proportion of activity associated with each benchmark. Observations If we assume production will be about 10% lower in the Phase IV baseline period (i.e. Phase IV HAL = 90), we would expect to avoid a CSCF if the weighted average benchmark reduction exceeded 1%. As we deviate from this scenario with a higher level of activity or lower benchmark reduction, we would expect to trigger a CSCF of increasing severity. Two such scenarios are shown below: one assuming 5% lower production in the Phase IV baseline period, coupled with a 1% weighted average benchmark reduction; and the other assuming 10% lower production in the Phase IV baseline period, coupled with a 0.5% weighted average benchmark reduction. 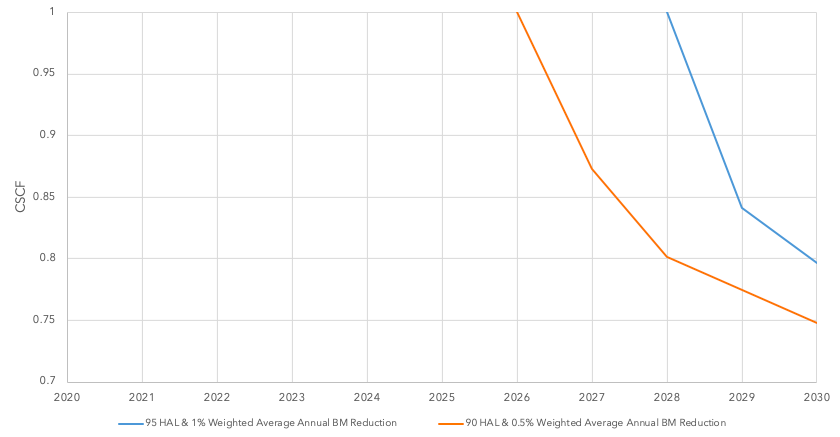 It is assumed in the graph that there is no change in the proportion of activity associated with the benchmarks, and that the number of free allowances available in a given year is 40.9% of the relevant annual cap, plus whatever remains of the CSCF buffer pool of allowances, which is 3% of the total cap (where the total cap is defined as above, assuming a 2.2% LRF throughout and inclusion of the UK).
The trajectory of the CSCFs reflects the fact that the 3% buffer is concealing a growing shortfall between entitlements and the annual cap. In the year the buffer runs out, this large shortfall is partially revealed. In the following year, the shortfall is fully revealed (including an additional year of the LRF). And from this point on the CSCF tracks the LRF. Uncertainties It is unclear where activity levels and benchmarks will come out at this stage. The Commission will gather data ahead of each half of the phase, so we will have a much better sense of the CSCF outlook in 2020, but the ultimate values will only be known around 2025. It is assumed in the modelling that the LRF is 2.2% throughout Phase IV, but this could be upgraded, which would increase the risk of a CSCF. Depending on how the Commission interprets the provisions in the ETS Directive, it is also possible that a CSCF might follow a different trajectory to the ones graphed above. For further information please contact [email protected] |